

You need a generator that won’t fail under load, and the wattage chart is your first filter. You’ll scan for running watts, not starting surge, because that’s your continuous baseline. Sum your appliances methodically, match the total to the chart’s output bands, and you’ll know if you’re undersized. But here’s where most buyers miscalculate—and one overlooked variable changes everything.
How to Read a Generator Wattage Chart
How do you interpret a generator wattage chart effectively? You locate your appliance power draw values and match them directly against the chart’s generator sizing ranges. The wattage chart displays running watts as its primary metric, so you’ll identify each appliance’s continuous power consumption and compare it to the listed generator capacities. You’re working with standardized data—every entry uses running watts consistently, eliminating conversion steps. This systematic approach lets you size equipment quickly: sum your appliances’ running watts, then select a generator whose rated output exceeds that total. The chart’s design prioritizes operational efficiency over surge calculations, streamlining your decision process. You’ll find generator sizing becomes a direct mapping exercise rather than complex computation, with running watts serving as your sole reference point across all comparisons.
Why Wattage Charts Prioritize Running Over Starting Watts

Why do wattage charts consistently emphasize running watts over starting watts when guiding your generator selection? You’ll find that running watts represent the continuous load your appliances demand during operation, forming the foundation of accurate generator sizing. Starting watts, while critical for motor startup, remain variable and momentary; they don’t reflect sustained energy requirements. When you size your generator, you’re planning for steady-state consumption, not transient spikes.
Charts prioritize running watts because they ensure consistency across diverse equipment—you’re matching your generator to real-world, nominal operating conditions rather than unpredictable surge demands. This systematic approach simplifies your planning process and reduces sizing errors.
How to Read Appliance Ratings on Generator Wattage Charts
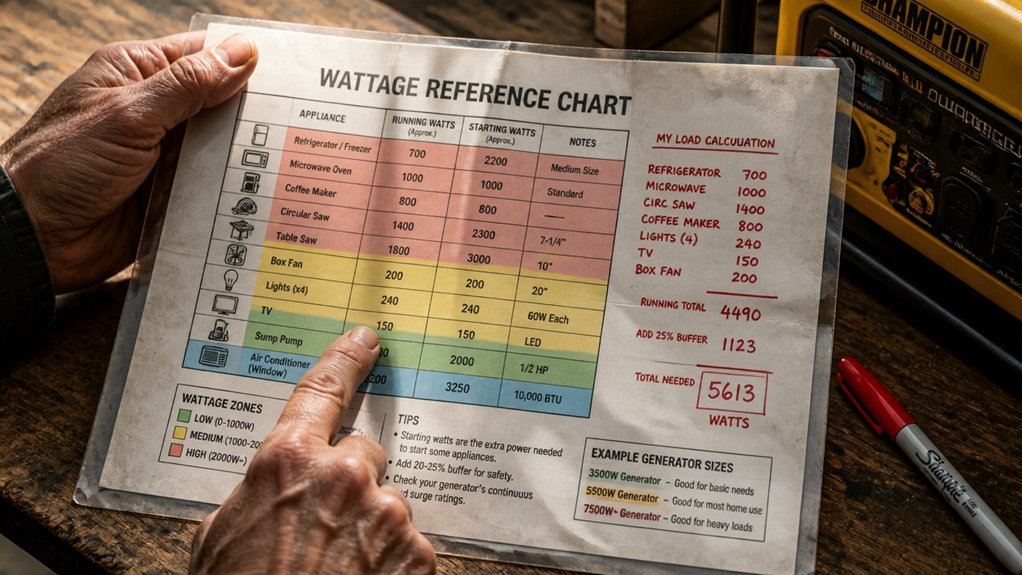
Understanding why charts prioritize running watts sets the stage for practical application: you now need to extract the correct values from the ratings themselves. You’ll scan the appliance ratings column to identify each unit’s running watts—the steady-state power consumption during normal operation. The chart applies a uniform rule: it lists running watts exclusively, eliminating starting surge data to streamline generator sizing. You match these figures against your generator’s continuous output capacity, ensuring the total running watts of your intended load falls within the rated limit. This systematic analysis prevents oversizing errors. You verify each appliance rating individually, summing the running watts to confirm compatibility. The data-driven approach yields precise generator sizing without speculative adjustments.
Should You Add Watts or Stagger Your Loads?
Whether you’re sizing a generator for a job site or home backup, you’ll face a critical decision: combine all running watts simultaneously or sequence your loads. The generator wattage chart resolves this through Appliance Principles A–D: you base generator sizing exclusively on running watts. You don’t add starting watts, and you don’t employ load staggering beyond these values.
This approach streamlines your planning. You reference uniform running watt data across all appliances, eliminating computational complexity. You avoid inflating capacity requirements with transient surge calculations. You match generators to loads with direct, repeatable precision.
The chart’s methodology treats running watts as your sole planning metric. You’ll size faster, reduce reference errors, and maintain systematic consistency. You reject both cumulative starting watt additions and artificial load sequencing. You’ll execute data-driven generator sizing with technical clarity, using one standardized figure: running watts.
Match Your Generator Wattage to Home, RV, or Job Site Loads
How do you translate appliance lists into generator specifications without overcomplicating the calculation? You use the Generator Wattage Chart to execute precise load matching based on running watts.
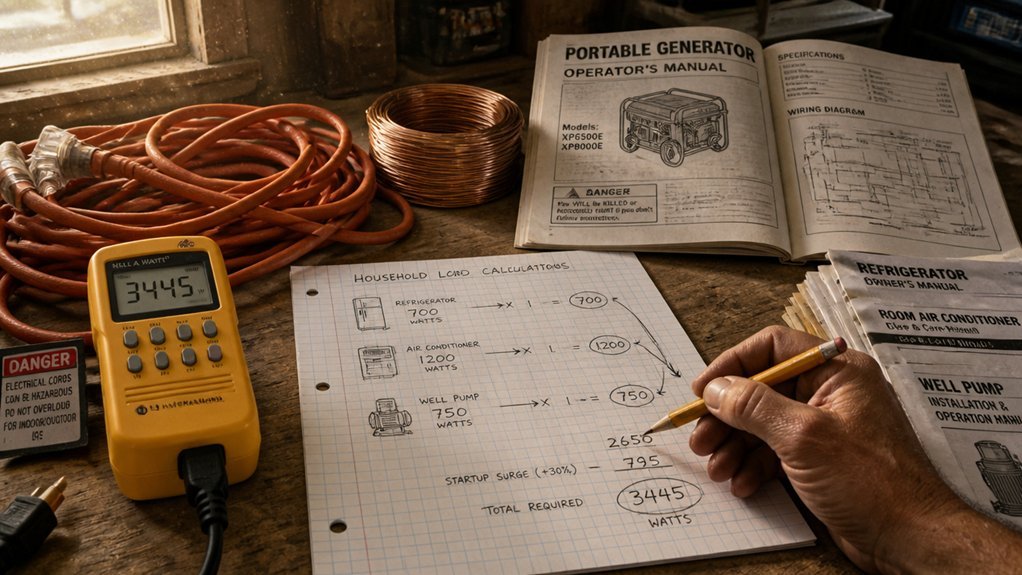
First, inventory every device you’ll operate simultaneously. Record each unit’s running watts from its nameplate or the chart’s quick-reference guidelines. Sum these values to establish your total appliance wattage requirement. Select generator capacity equal to or exceeding this aggregate running watts figure.
The chart eliminates guesswork by treating running watts as your primary sizing metric. You disregard starting watts entirely; Appliance Principles A–D confirm that continuous running watts alone drive your selection. This data-driven approach ensures systematic analysis of your electrical demand, whether you’re powering a home, RV, or job site. You match generator output precisely to actual sustained load requirements.
Wattage Mistakes That Overload Your Generator
Although you’ve matched your generator’s running wattage to your appliance list, you’ll still overload the unit if you ignore how starting surges and simultaneous switching interact with that capacity. When you cluster multiple high-wattage devices—space heaters, well pumps, power tools—you exceed continuous running capacity instantly. Each motor-driven appliance demands startup surge wattage three to five times its running watts; your generator sizing must accommodate these transient spikes. If you rely solely on running watts for generator sizing, you’ll trigger overload during compressor or motor start cycles. A wattage chart emphasizing running watts without startup surge data misleads you into undersized selection. You’ll experience tripped breakers, voltage drop, and thermal shutdown. Systematic analysis requires you to stagger switch-on sequences and reserve capacity for peak demands, ensuring continuous operation without overload.
How Portable and Standby Wattage Charts Differ
Why do generator sizing guides yield conflicting recommendations for the same appliance list? You’re encountering divergent methodologies between portable charts and standby charts.
Portable charts prioritize running watts for steady-state operation, sizing your unit based on continuous load requirements. You’re directed to match generator capacity to operating wattage sums, often omitting starting watts from calculations.
Standby charts incorporate both running watts and starting watts, ensuring you’ve accounted for motor surge demands during startup. You’re analyzing load profiles differently: portable charts assume you’ll stagger starts manually, while standby charts automate immediate power restoration, necessitating higher surge capacity.
You’re selecting between simplicity and comprehensive coverage—portable charts streamline sizing for intermittent use, whereas standby charts engineer guaranteed performance for critical systems without user intervention during outages.
Double-Check Your Wattage Chart Results Before Buying
Where exactly do wattage charts diverge from your actual power requirements? Charts often display aggregated estimates rather than device-specific running watts, creating systematic sizing errors.
You must verify that listed running watts match your actual appliances. Generic tables assume standard loads; your refrigerator, pump, or HVAC unit may exceed these baselines. You’re risking undersized continuous power capacity or ignored surge watts headroom if you trust charts blindly.
You need to sum verified running watts, then cross-check against the generator’s continuous power rating and surge watts margin for motor-starting peaks. You can’t exclude concealed loads—garage door openers, well pumps, or cycling compressors from your total.
You should reconcile discrepancies with a watt meter. Measure real-time running watts at the outlet; this empirical data overrides theoretical chart values. You eliminate guesswork, optimize cost-efficiency, and prevent catastrophic overload failure through this systematic analysis.
Conclusion
You verify running watts, sum your loads, and map the total to your chart’s continuous-output range. You sequence starts for portable units; you account for surge tolerances in standby systems. You cross-check with real measurements before purchase. This systematic, data-driven approach eliminates guesswork and guarantees reliable generator sizing.